SAP and DataRobot are taking their partnership to new heights by strengthening their collaboration through the integration of predictive and generative AI capabilities. We have developed a cutting-edge partnership that will empower customers to generate value with AI by seamlessly connecting core SAP BTP with DataRobot AI capabilities.
As an example, let’s explore how organizations can harness the power of predictive and generative AI to streamline invoice processing offering a faster, more accurate and cost-effective alternative to manual review and validation.
The Business Problem
Right now companies of all sizes grapple with a common challenge: the relentless influx of invoices. The substantial amount of financial documentation can be overwhelming, often necessitating an army of employees dedicated to manual review and validation. However this approach is not only time-consuming and costly, but also prone to human error, making it a fragile link in the financial chain.
Harnessing the potential of AI is more important than ever before. Businesses can employ predictive AI models to learn from historical invoice data, recognize patterns, and automatically flag potential anomalies in real-time. This not only accelerates the validation process but also significantly reduces the margin of error, preventing costly mistakes. Furthermore, the integration of generative AI allows for the concise summarization of detected anomalies, improving communication and making it easier for teams to take swift and informed actions.
SAP and DataRobot Integrated AI Solution
This AI application enhances invoice processing through a combination of a predictive and generative AI to identify irregularities among invoices and to communicate the issues around the invoices.
- Leverage Predictive AI model for anomaly detection.
- Business perspective: Anomaly detection can help identify irregularities, such as incorrect amounts, missing information or unusual patterns, before processing payments.
- Implementation: Train the model using historical invoice data to recognize patterns and typical invoice characteristics. When processing new invoices, the AI model can flag potential anomalies for review, reducing the risk of errors and fraud.
- Generative AI Summarization:
- Business perspective: After identifying anomalies, it is important to communicate the issues to the relevant team members. Traditional reporting methods may be wordy and time-consuming. Generative AI can help interpret and summarize the detected anomalies in a concise and human-readable format.
- Implementation: Leverage a LLM to generate an explanatory summary of the detected anomalies. The AI model can extract key information from the anomaly detection results and provide a clear and structured narrative that summarizes the detected anomalies and the reasons to be considered anomalies, making it easier for analysts and managers to understand the issues.
Architecture and Implementation Overview
To achieve these objectives, our platforms make use of various integration points, as illustrated in the architecture graph below:

1. Data preparation and ingestion
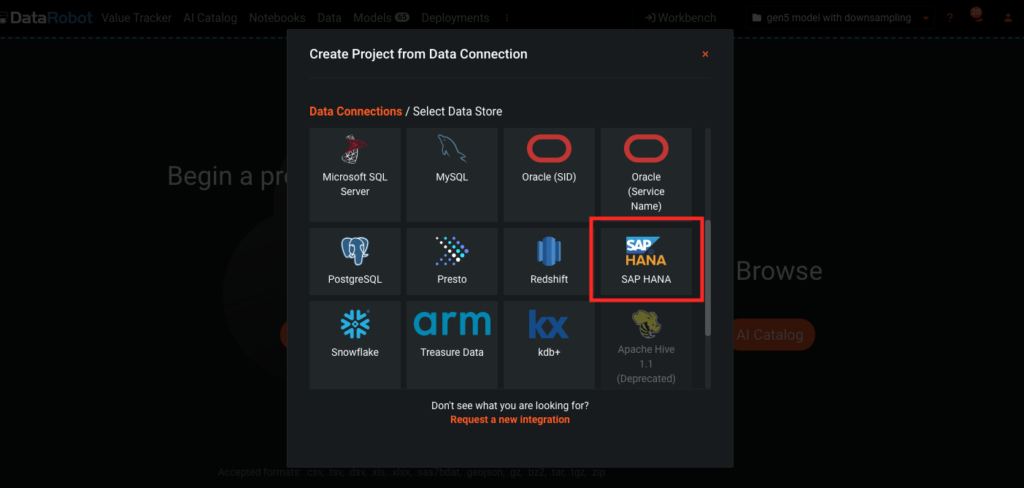
Invoice data is prepared and parsed in SAP Datasphere / HANA Cloud. DataRobot accesses and ingest this data from HANA Cloud through a JDBC connector.
2. Feature engineering and predictive model training
DataRobot engineers features and conducts experiments with the invoice data set, allowing you to train anomaly detection models that excel at spotting invoices with irregular or abnormal information. The approach you choose can be tailored to your specific data scenario—whether you have labeled data or not. You have options to address this challenge effectively, either with a supervised or an unsupervised approach.
In this case, we utilized historical records that had been categorized as anomalies and non-anomalies. After data ingestion, DataRobot runs an extensive data exploratory analysis, identifies any data quality issues, and automatically generates new features and relevant feature lists. With that ready, we were able to conduct a comprehensive analysis through 64 distinct experiments in a short period of time. As a result, we were able to pinpoint the top-performing model at the forefront of the leaderboard. This approach allowed us to select the most effective predictive model for the task at hand.
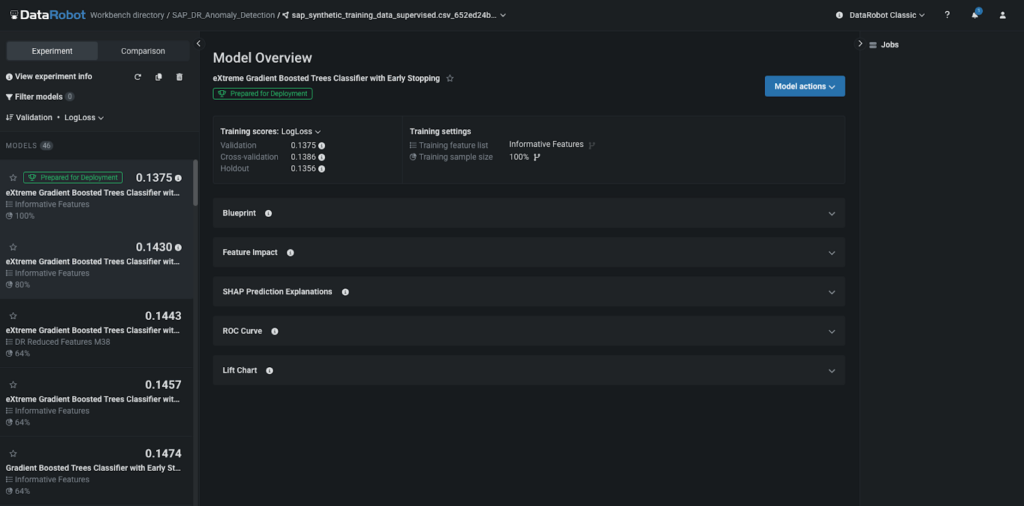
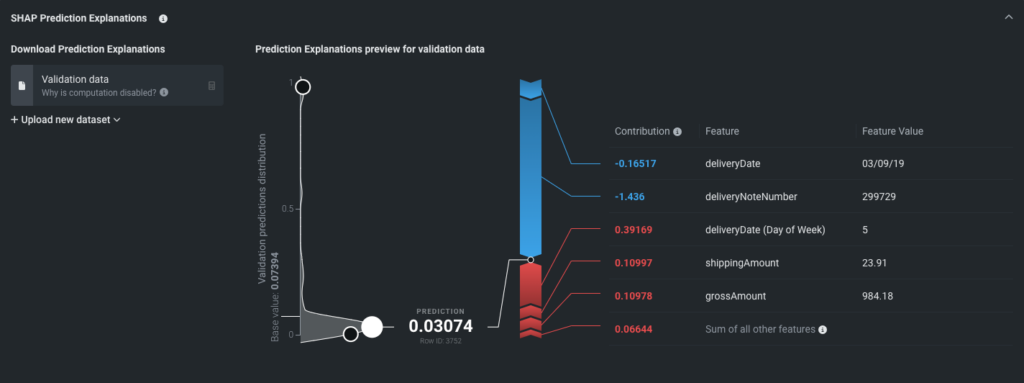
Within each of these experiments, you have the opportunity to thoroughly assess and gauge their performance. This analysis provides valuable insights into how each predictive model leverages the features within your invoice to make accurate predictions. To facilitate this process, you have access to an array of tools, including lift charts, ROC curve, and SHAP prediction explanations, which estimate how much each feature contributes to a given prediction. These insights offer an intuitive means to gain a deeper understanding of the model’s behavior and their influence of the invoice data, ensuring you make well-informed decisions.

3. Model deployment
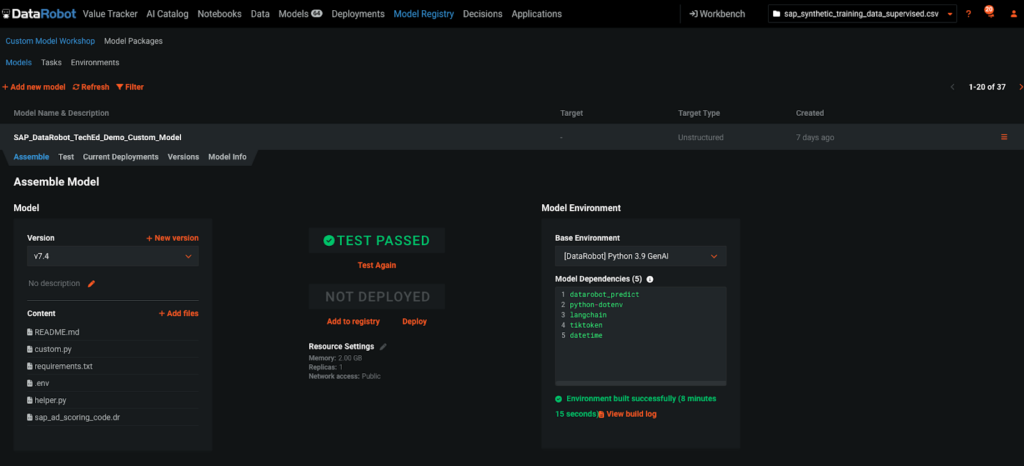
Once we identify the optimal predictive model, we move forward to transition the solution into production. This phase seamlessly merges our predictive and generative AI approach by orchestrating the deployment of an unstructured model within DataRobot. This deployment harmonizes the predictive AI model for anomaly detection with a Large Language Model (LLM), which excels in generating text to communicate the predictive insights. Alternatively, you have the flexibility to deploy predictive AI models directly within SAP AI Core, offering an additional route for operationalizing your solution.
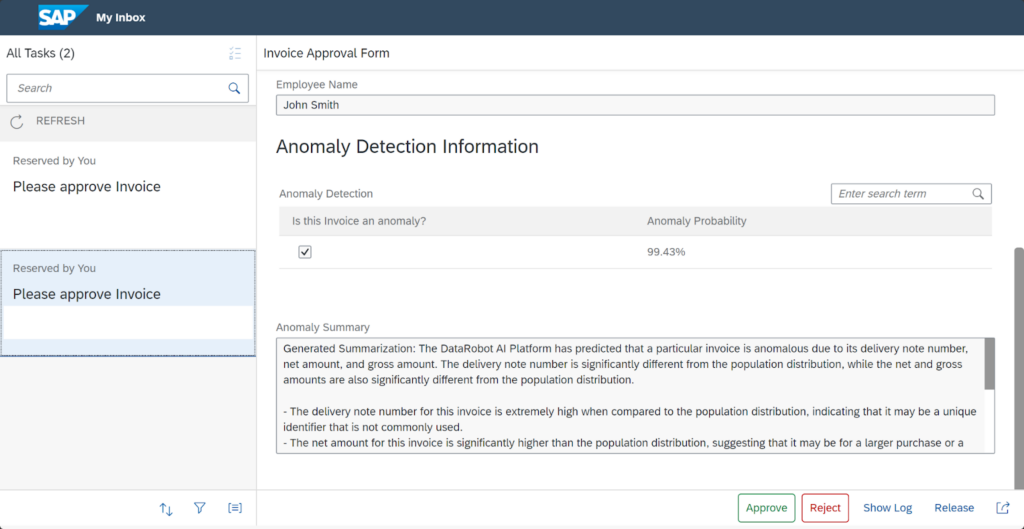
The LLM summarizes the rationales linked to each prediction, making it readily digestible for your financial analysis needs. This versatile deployment strategy ensures that the insights generated are accessible and actionable in a manner that suits your unique business requirements.
Two simple python files easily orchestrate this integration through simple functions and hooks that will be executed each time an invoice requires a prediction and its consecutive analysis. The first file named helper.py, has the credentials to connect with GPT 3.5 through Azure and contains the prompt to summarize the explanations and insights derived from the predictive model. The second file, named custom.py, easily orchestrates the whole predictive and generative pipeline through a few simple hooks. You can find an example of how to construct custom python files for unstructured models in our github repository.
You have the capability to test and validate this unstructured model prior its deployment, assuring that it consistently produces the intended outcomes, free of any operational hitches.
4. Business Application
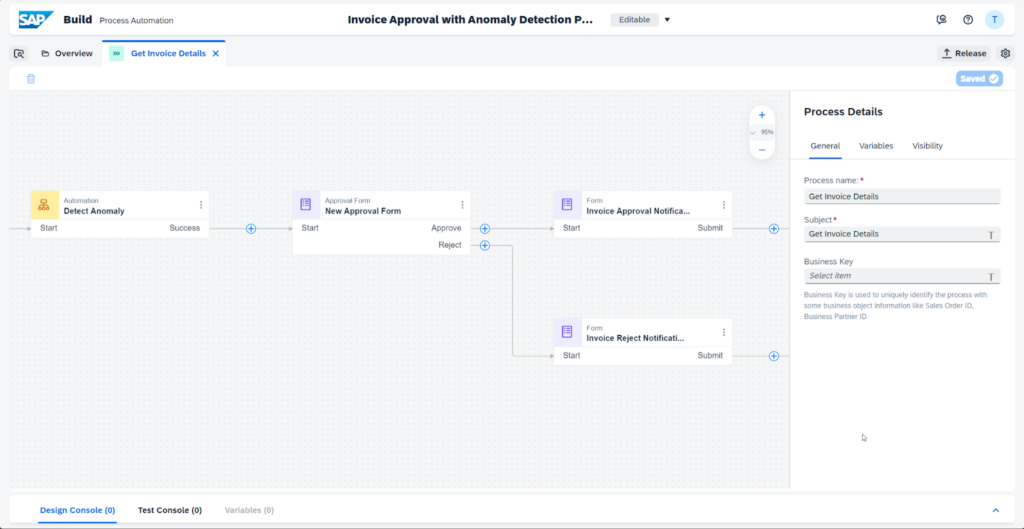
Once the deployment is officially in production, an accessible API endpoint becomes your bridge to connect with the deployment, seamlessly generating the precise results you seek in SAP Build.
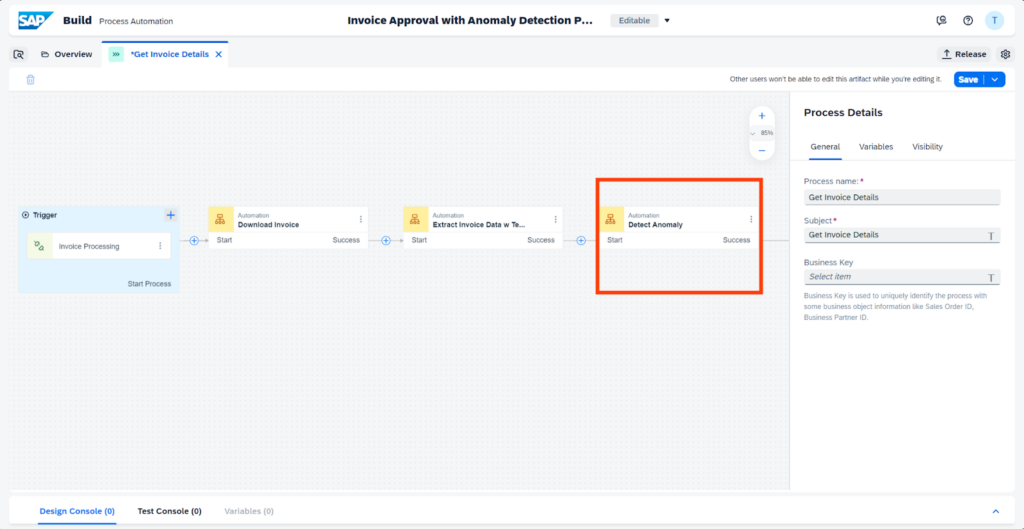
Next, we craft a business application for invoice anomaly detection within SAP Build. This application retrieves the predictive and generative output via API integration and offers a user-friendly interface. It presents the results in a practical and intuitive manner, ensuring that financial analysts can effortlessly upload invoices in PDF format, simplifying their workflow and enhancing the overall user experience.
5. Production Monitoring
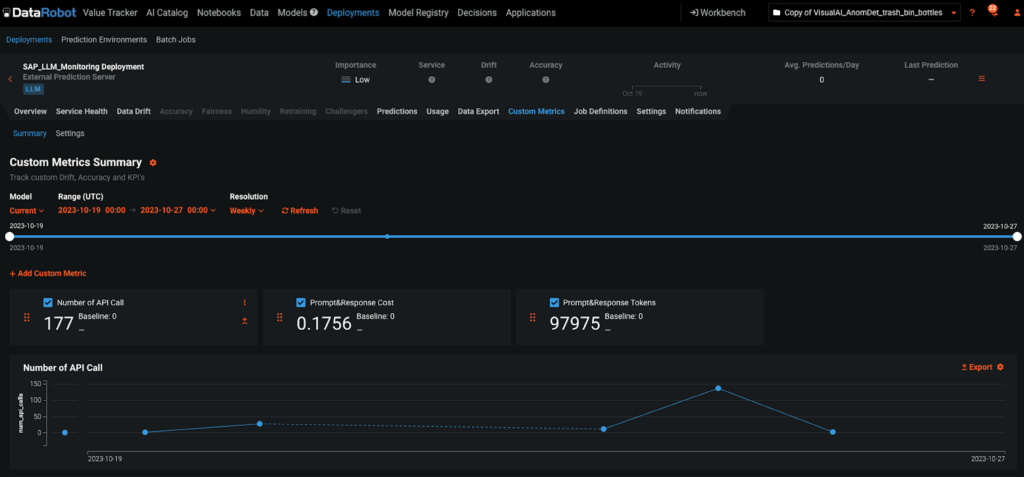
DataRobot maintains an oversight over the generative AI pipeline through the utilization of custom performance metrics and predictive models. This rigorous monitoring process ensures the continuous reliability and efficiency of our solution, offering you a seamlessly dependable experience.
Conclusion
In summary, the partnership between SAP and DataRobot continues to allow organizations to quickly drive value from their AI investments, and now even more by leveraging generative AI. Predictive anomaly detection and generative AI can transform the challenges and risks associated with invoice processing. Efficiency and accuracy soar, while communication becomes clearer and more streamlined. Businesses can now modernize their operations, save time and reduce errors. It is time to unlock the potential of this transformative technology and take your operations to the next level.
Learn how your team can develop, deliver, and govern AI apps and AI agents with DataRobot.
Related posts
See other posts in AI PartnersRelated posts
See other posts in AI PartnersGet Started Today.