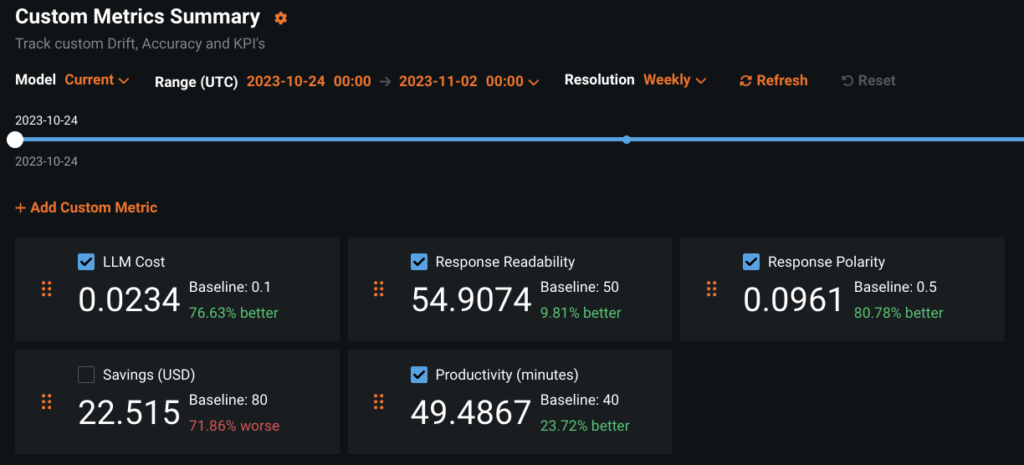
CIOs and other technology leaders have come to realize that generative AI (GenAI) use cases require careful monitoring – there are inherent risks with these applications, and strong observability capabilities helps to mitigate them. They’ve also realized that the same data science accuracy metrics commonly used for predictive use cases, while useful, are not completely sufficient for LLMOps.
When it comes to monitoring LLM outputs, response correctness remains important, but now organizations also need to worry about metrics related to toxicity, readability, personally identifiable information (PII) leaks, incomplete information, and most importantly, LLM costs. While all these metrics are new and important for specific use cases, quantifying the unknown LLM costs is typically the one that comes up first in our customer discussions.
This article shares a generalizable approach to defining and monitoring custom, use case-specific performance metrics for generative AI use cases for deployments that are monitored with DataRobot AI Platform.
Remember that models do not need to be built with DataRobot to use the extensive governance and monitoring functionality. Also remember that DataRobot offers many deployment metrics out-of-the-box in the categories of Service Health, Data Drift, Accuracy and Fairness. The present discussion is about adding your own user-defined Custom Metrics to a monitored deployment.

To illustrate this feature, we’re using a logistics-industry example published on DataRobot Community Github that you can replicate on your own with a DataRobot license or with a free trial account. If you choose to get hands-on, also watch the video below and review the documentation on Custom Metrics.
Monitoring Metrics for Generative AI Use Cases
While DataRobot offers you the flexibility to define any custom metric, the structure that follows will help you narrow your metrics down to a manageable set that still provides broad visibility. If you define one or two metrics in each of the categories below you’ll be able to monitor cost, end-user experience, LLM misbehaviors, and value creation. Let’s dive into each in future detail.
Total Cost of Ownership
Metrics in this category monitor the expense of operating the generative AI solution. In the case of self-hosted LLMs, this would be the direct compute costs incurred. When using externally-hosted LLMs this would be a function of the cost of each API call.
Defining your custom cost metric for an external LLM will require knowledge of the pricing model. As of this writing the Azure OpenAI pricing page lists the price for using GPT-3.5-Turbo 4K as $0.0015 per 1000 tokens in the prompt, plus $0.002 per 1000 tokens in the response. The following get_gpt_3_5_cost function calculates the price per prediction when using these hard-coded prices and token counts for the prompt and response calculated with the help of Tiktoken.
import tiktoken
encoding = tiktoken.get_encoding("cl100k_base")

def get_gpt_token_count(text):
    return len(encoding.encode(text))

def get_gpt_3_5_cost(
    prompt, response, prompt_token_cost=0.0015 / 1000, response_token_cost=0.002 / 1000
):
    return (
        get_gpt_token_count(prompt) * prompt_token_cost
        + get_gpt_token_count(response) * response_token_cost
    )
User Experience
Metrics in this category monitor the quality of the responses from the perspective of the intended end user. Quality will vary based on the use case and the user. You might want a chatbot for a paralegal researcher to produce long answers written formally with lots of details. However, a chatbot for answering basic questions about the dashboard lights in your car should answer plainly without using unfamiliar automotive terms.
Two starter metrics for user experience are response length and readability. You already saw above how to capture the generated response length and how it relates to cost. There are many options for readability metrics. All of them are based on some combinations of average word length, average number of syllables in words, and average sentence length. Flesch-Kincaid is one such readability metric with broad adoption. On a scale of 0 to 100, higher scores indicate that the text is easier to read. Here is an easy way to calculate the Readability of the generative response with the help of the textstat package.
import textstat

def get_response_readability(response):
    return textstat.flesch_reading_ease(response)
Safety and Regulatory Metrics
This category contains metrics to monitor generative AI solutions for content that might be offensive (Safety) or violate the law (Regulatory). The right metrics to represent this category will vary greatly by use case and by the regulations that apply to your industry or your location.
It is important to note that metrics in this category apply to the prompts submitted by users and the responses generated by large language models. You might wish to monitor prompts for abusive and toxic language, overt bias, prompt-injection hacks, or PII leaks. You might wish to monitor generative responses for toxicity and bias as well, plus hallucinations and polarity.
Monitoring response polarity is useful for ensuring that the solution isn’t generating text with a consistent negative outlook. In the linked example which deals with proactive emails to inform customers of shipment status, the polarity of the generated email is checked before it is shown to the end user. If the email is extremely negative, it is over-written with a message that instructs the customer to contact customer support for an update on their shipment. Here is one way to define a Polarity metric with the help of the TextBlob package.
import numpy as np
from textblob import TextBlob

def get_response_polarity(response):
    blob = TextBlob(response)
    return np.mean([sentence.sentiment.polarity for sentence in blob.sentences])
Business Value
CIO are under increasing pressure to demonstrate clear business value from generative AI solutions. In an ideal world, the ROI, and how to calculate it, is a consideration in approving the use case to be built. But, in the current rush to experiment with generative AI, that has not always been the case. Adding business value metrics to a GenAI solution that was built as a proof-of-concept can help secure long-term funding for it and for the next use case.
The metrics in this category are entirely use-case dependent. To illustrate this, consider how to measure the business value of the sample use case dealing with proactive notifications to customers about the status of their shipments.
One way to measure the value is to consider the average typing speed of a customer support agent who, in the absence of the generative solution, would type out a custom email from scratch. Ignoring the time required to research the status of the customer’s shipment and just quantifying the typing time at 150 words per minute and $20 per hour could be computed as follows.
def get_productivity(response):
    return get_gpt_token_count(response) * 20 / (150 * 60)
More likely the real business impact will be in reduced calls to the contact center and higher customer satisfaction. Let’s stipulate that this business has experienced a 30% decline in call volume since implementing the generative AI solution. In that case the real savings associated with each email proactively sent can be calculated as follows.
def get_savings(CONTAINER_NUMBER):
    prob = 0.3
    email_cost = $0.05
    call_cost = $4.00
    return prob * (call_cost - email_cost)
Create and Submit Custom Metrics in DataRobot
Create Custom Metric
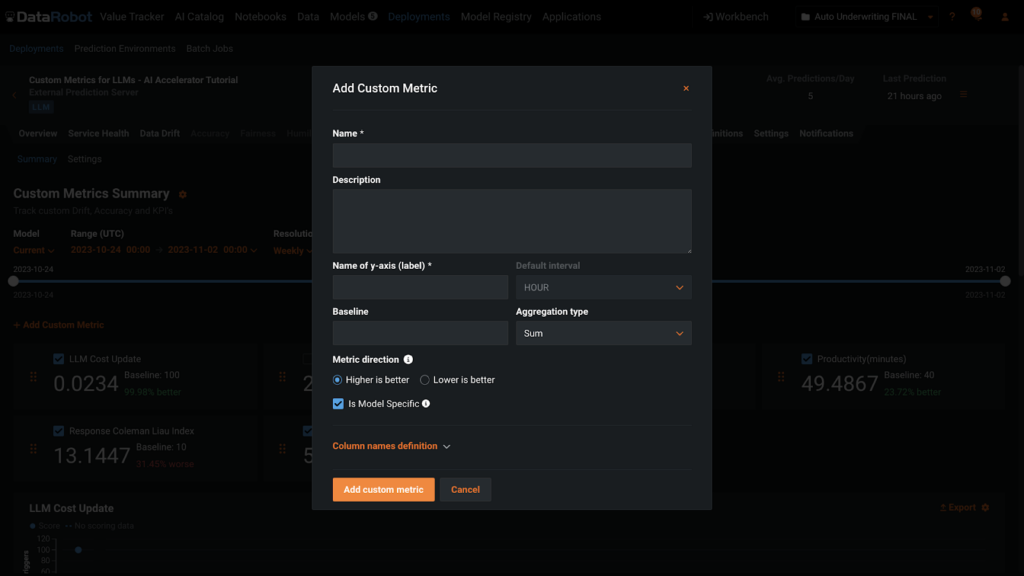
Once you have definitions and names for your custom metrics, adding them to a deployment is very straight-forward. You can add metrics to the Custom Metrics tab of a Deployment using the button +Add Custom Metric in the UI or with code. For both routes, you’ll need to supply the information shown in this dialogue box below.

Submit Custom Metric
There are several options for submitting custom metrics to a deployment which are covered in detail in the support documentation. Depending on how you define the metrics, you might know the values immediately or there may be a delay and you’ll need to associate them with the deployment at a later date.
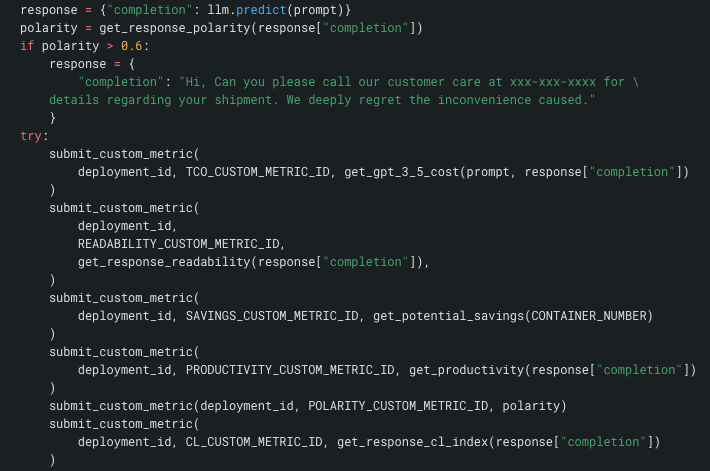
It is best practice to conjoin the submission of metric details with the LLM prediction to avoid missing any information. In this screenshot below, which is an excerpt from a larger function, you see llm.predict() in the first row. Next you see the Polarity test and the override logic. Finally, you see the submission of the metrics to the deployment.
Put another way, there is no way for a user to use this generative solution, without having the metrics recorded. Each call to the LLM and its response is fully monitored.

DataRobot for Generative AI
We hope this deep dive into metrics for Generative AI gives you a better understanding of how to use the DataRobot AI Platform for operating and governing your generative AI use cases. While this article focused narrowly on monitoring metrics, the DataRobot AI Platform can help you with simplifying the entire AI lifecycle – to build, operate, and govern enterprise-grade generative AI solutions, safely and reliably.
Enjoy the freedom to work with all the best tools and techniques, across cloud environments, all in one place. Breakdown silos and prevent new ones with one consistent experience. Deploy and maintain safe, high-quality, generative AI applications and solutions in production.
Monitor, manage, and govern all of your large language models
Download NowRelated posts
See other posts in Inside the ProductRelated posts
See other posts in Inside the ProductGet Started Today.

